Spatial distribution of state-level sports industry bases in China
Quantitative distribution of state-level sports industry bases
In terms of regional distribution and the number of recognized bases, the 334 China State-level Sports Industry Bases that have been named and recognized cover 31 provincial regions. In terms of the distribution of the number of Sports Industry Bases, the top five provinces in the country are Zhejiang Province, Jiangsu Province, Fujian Province, Shanghai Municipality and Shandong Province, with 40, 32, 30, 25 and 25 bases, respectively. According to the classification of “three types”, among the existing 79 demonstration bases, the top three in terms of quantity are Zhejiang Province (12), Shandong Province (8), and Jiangsu Province (7). Among the 143 demonstration units, Fujian Province (17), Beijing Municipality (16), and Jiangsu Province (15) ranked in the top 3. Among 112 demonstration projects, Zhejiang Province (15), Fujian Province (11), and Shanghai Municipality (10) are among the top 3 in the country (Fig. 1). The construction of Sports Industry Bases in Beijing, Jiangsu, Zhejiang, Shanghai, Fujian and other regions is at a leading level. With the deepening of the concept of industrial integration in recent years, the sports industry has been exchanging and interoperating with many fields. At present, the State-level Sports Industry Bases have formed the trend of the integration and development of sports competition performance, fitness and leisure, sporting goods, stadiums and other industries. Among them, the integration of the sports industry with tourism, culture, recreation, science and technology has become a new growth point for local economic development.

Provincial distribution of State-level Sports Industry Bases (2006–2021).
Location characteristics of state-level sports industry bases
In 2006, approved by the State General Administration of Sports, Shenzhen set up the first State-level Sports Industry Bases, marking the official start of the exploration and practice of the State-level Sports Industry Bases. From 2006 to 2010, five cities and counties, such as Wenjiang in Chengdu, Jinjiang in Fujian, Longtan Lake in Beijing, Fuyang in Hangzhou, and Leling in Shandong, were approved as State-level Sports Industry Bases. In 2013, according to the “Management Measures of State-level Sports Industry Bases (Trial)”, the State General Administration of Sports officially named the first county cluster-type State-level Sports Industry Bases-Jiangsu Province Sunan (county) State-level Sports Industry Bases. In the same year, Beijing Olympic Park was recognized as the first state-level sports industry demonstration unit. In 2016, to fully implement the spirit of Document No. 46 of the State Council, the State General Administration of Sports proposed in the “13th Five-Year Plan for Sports Development” that, by 2020, 50 State-level Sports Industry demonstration bases in counties with larger scale of industry and obvious clustering effects would be set up nationwide, and 100 State-level Sports Industry demonstration units and 100 State-level Sports Industry demonstration projects with high reputation and international influence and strong market competitiveness would be established. To facilitate differentiation through location markers, Fig. 2 displays the locational characteristics of State-level Sports Industry bases for each year from 2016 to 2021, following the standardization of the concept and content system of State-level Sports Industry bases. The distribution density of State-level Sports Industry bases gradually increases from the western region to the central region and then to the eastern region. To further analyze the spatial associations, hotspots, or aggregation areas, as well as the shift in distribution centers of State-level Sports Industry Bases in recent years, exploratory spatial data analysis (ESDA) and spatial center-of-gravity shift models have been employed for in-depth investigations.

Time-sharing of the spatial distribution of State-level Sports Industry Bases. Note: This figure is based on the standard map No. GS(2020)4619 downloaded from the website of the Standard Map Service of the Ministry of Natural Resources (https://www.mnr.gov.cn/), and the base map has not been modified. This figure was produced using the Arc Geographic Information System, ArcGIS, version 10.6 (https://www.arcgis.com/).
Spatial pattern of the distribution of state-level sports industry bases
Global spatial autocorrelation test
Owing to differences in the concept and content system of State-level Sports Industry Bases in China before and after 2016 and given that the majority of provinces had zero State-level Sports Industry Bases prior to 2016 (with only 25 State-level Sports Industry Bases established in China between 2006 and 2015), a sample of 309 State-level Sports Industry Bases from 2016 to 2021 is selected for analysis of spatial distribution patterns and influencing factors. As shown in Table 1, under the three spatial weight matrices, the Moran index of the number of Sports Industry Bases in China’s provinces and regions from 2016 to 2018 is mostly positive, and the P value passes the 5% significance test, which is significantly different. The growth of the Moran index in successive years indicates that the state of agglomeration is constantly increasing. Among them, there are strong spatial agglomeration characteristics under the economic distance matrix for three consecutive years, which reflects that the economic strength of each province and region can enhance the agglomeration degree and development scale of the State-level Sports Industry Bases, and it is an important reference factor for the relevant departments to identify the Sports Industry Bases. In 2019, State-level Sports Industry Bases exhibited a random distribution. From 2020–2021, under the neighborhood matrix and geographic distance matrix, State-level Sports Industry Bases differ significantly and present spatial agglomeration characteristics, but the agglomeration state weakens annually. This result shows that, in recent years, the geographical distribution of State-level Sports Industry Bases has become more reasonable, the development mode has become more diversified, and the relevant departments have paid more attention to the balanced development of geographical regions rather than concentrating on economically developed regions in their audit and recognition. Taking Xinjiang as an example, among its only four Sports Industry Bases, three, namely, the Altay State-level Sports Industry Demonstration Base (Demonstration Base), Xinjiang Kerala Investment Company Limited (Demonstration Project), and A-Man Fitness Chain Fitness Project (Demonstration Project), are recognized from 2020 to 2021. However, at the same time, the dependence of the distribution of State-level Sports Industry Bases on geographical proximity weakens annually.
Local spatial autocorrelation test
The local Moran index indicates the distribution characteristics of the variables exhibited in the local subspace system, 2016 and 2021 were selected as the representative years to generate the Moran scatter plot (Figs. 3, 4 and 5). As shown in Fig. 4, most of the provinces are distributed in the third quadrant, i.e., the low-low agglomeration blind spot area (LL area). Among them, Shanghai, Shandong, Zhejiang and Jiangsu are always in the first quadrant, i.e., the high-high agglomeration hotspot zone (HH zone); these four provinces are located in the eastern coastal region, with a more developed economy, stronger consumption ability of the residents, and better development momentum of the sports industry. Tianjin, Anhui and Jiangxi are always in the second quadrant, i.e., the low–high–strong enemy surrounding area (LH area), and the number of Sports Industry Bases relatively lags behind the neighboring regions; Beijing and Shanxi are always in the fourth quadrant, i.e., the high–low–crane flocking area (HL area). This shows that the number of Sports Industry Bases is relatively ahead of the neighboring regions. Shanxi enters the HL zone from the LL zone, i.e., through its efforts, the number of Sports Industry Bases surpasses that of neighboring provinces. Chongqing enters the LL zone from the HL zone, i.e., the number of its own Sports Industry Bases declines, and Fujian enters the HH zone from the LH zone, indicating that the number of Sports Industry Bases gradually catches up with that of neighboring provinces. Under the geographical weight matrix, most provinces are distributed in the second and third quadrants. The southeastern coastal provinces are located in the LL zone. Its number of Sports Industry Bases in 2016 showed a negative spatial correlation, i.e., provinces with a high number of Sports Industry Bases were mostly surrounded by provinces with a low number, whereas provinces with a low number of bases were surrounded by a greater number of provinces with a high number of bases. In the regional quadrant change, Inner Mongolia enters the HL zone from the LH zone, i.e., the number of its own Sports Industry Bases increases, and the surrounding provinces decrease again. Hebei enters the HH zone from the LH zone, indicating that the sports industry is developing rapidly and that the number of bases is gradually catching up with the neighboring provinces. Guangxi entered the HL zone from the LL zone, and the number of Sports Industry Bases surpassed that of the neighboring provinces. In the economic distance weight matrix, economically developed Shanghai, Beijing, Zhejiang and Jiangsu are always located in the first quadrant. Compared with the changes between 2016 and 2021, Inner Mongolia entered the LH zone from the HH zone; i.e., the number of its own Sports Industry Bases decreased. Sichuan enters the HH zone from the LL zone, i.e., the number of bases in both the province and neighboring provinces increases. Guangxi, Hunan and Chongqing enter the LL zone from the HL zone, i.e., the number of their own bases decreases. Shandong enters the HL zone from the HH, indicating a decline in the number of bases in neighboring provinces. Hebei enters the HL zone from the LL zone, i.e., the number of bases in the province continues to rise relative to neighboring regions.
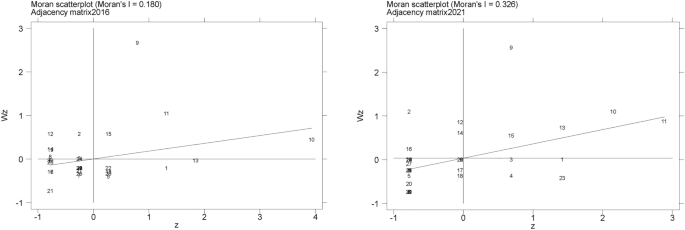
Moran scatter diagram under adjacency matrix.
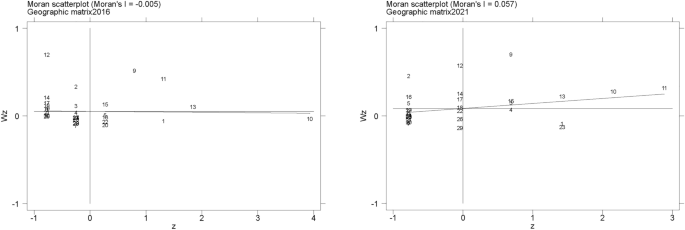
Moran scatter diagram under geographic matrix.
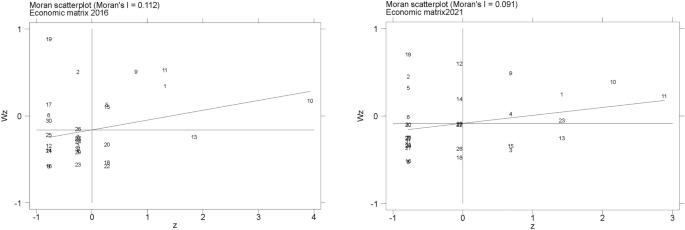
Moran scatter diagram under economic distance matrix. Note: No. 1 for Beijing, No. 2 for Tianjin, No. 3 for Hebei, No. 4 for Shanxi, No. 5 for Inner Mongolia, No. 6 for Liaoning, No. 7 for Jilin, No. 8 for Heilongjiang, No. 9 for Shanghai, No. 10 for Jiangsu, No. 11 for Zhejiang, No. 12 for Anhui, No. 13 for Fujian, No. 14 for Jiangxi, No. 15 for Shandong, No. 16 for Henan, No. 17 for Hubei, No. 18 for Hunan, No. 19 for Guangdong, No. 20 for Guangxi, No. 21 for Hainan, No. 22 for Chongqing, No. 23 for Sichuan, No. 24 for Guizhou, No. 25 for Yunnan, No. 26 for Xizang, No. 27 for Shaanxi, No. 28 for Gansu, No. 29 for Qinghai, No. 30 for Ningxia, No. 31 for Xinjiang.
Analysis of the concentration and balance of the distribution of state-level sports industry bases
The spatial autocorrelation analysis only shows the correlation between the number of State-level Sports Industry Bases in each province and region, but it cannot further explore the degree of concentration and dispersion of their distribution, as well as the degree of equilibrium of distribution. Therefore, the spatial Gini coefficient and imbalance index are used to measure the overall distribution of State-level Sports Industry Bases, as well as the concentration and balance of distribution across the seven major geographical regions; the relevant results are shown in Table 2.
As shown in Table 2, (1) in the total distribution of State-level Sports Industry Bases in each region, East China is in the lead, followed by North China, Central China, Southwest China, South China, Northwest China and Northeast China. In terms of the average distribution of provinces and regions, East China and Central China are in the first two places, exceeding the national average. These regions are followed by North China, South China, Southwest China, Northeast China and Northwest China. (2) In terms of the spatial Gini coefficient and distribution dispersion, from a national perspective, the State-level Sports Industry Bases have the highest degree of agglomeration. From different geographical perspectives, the distribution of State-level Sports Industry Bases is most concentrated in Northeast China, followed by East China, Northwest China, South China, Central China, Southwest China, and North China, with the degree of agglomeration of State-level Sports Industry Bases decreasing in order. (3) Imbalance index: China’s territory is vast, and the distribution of State-level Sports Industry Bases from the national perspective has the highest imbalance index and is the most dispersed. The distributions in East China and Northeast China are the most balanced, and the imbalance in the remaining regions ranges from low to high in Northwest China, South China, Southwest China, Central China and North China. The economic strength of the seven provinces (cities) in East China is relatively strong in the country, and the sports industry in each province and region has more distinctive characteristics, such as the sports service industry in Shanghai and the sporting goods manufacturing industry in Fujian Province. Overall, the development of State-level Sports Industry Bases in East China is relatively balanced. However, the distribution in Central China is less balanced, indicating that there are obvious provincial differences in the development of the sports industry in Shanxi, Hebei and Inner Mongolia in North China, which also causes an imbalance in the distribution of the State-level Sports Industry Bases.
Standard elliptic difference analysis of state-level sports industrial bases
The distributions of the State-level Sports Industry Bases in each province and domain present different characteristics over time, and the specific transfer direction is measured by the spatial center of the gravity transfer model. As shown in Fig. 6a, the default parameter is chosen as an ellipse of 1 standard deviation size, i.e., the ellipse range can encompass 68% of the Sports Industry Bases in China. In 2016, with 2049.65 km as the long half-axis (X-axis) and 1603.25 km as the short half-axis (Y-axis), the flattening rate was 446.4 km, and the direction angle was 107.86. The overall trend of the distribution is in the northwest‒southeast direction. In 2017, the X-axis was extended to 2,395.93 km, the Y-axis was extended to 1661.87 km, the flattening rate was 734.06 km, and the angle of direction was 64.7. The discrete degree of distribution of the Sports Industry Bases increased, and the direction of distribution changed to southwest-northeast. In 2018, the X-axis was shortened to 1798.65 km, the Y-axis was shortened to 1548.15 km, the flatness was 250.5 km, and the angle of direction was 90.22. The distribution is “south‒north”, the centripetal force is increased, and the directional characteristics are weakened. In 2019, the X-axis was extended to 1875.47 km, the Y-axis was extended to 1715.42, the oblateness was 174.05, and the angle of direction was 71.82. The distribution is still “south‒north”, with the degree of centripetal force decreasing, the degree of dispersion increasing, and the directional characteristics further weakening. In 2020, the X-axis lengthened to 2029.89 km, the Y-axis shortened to 1628.50 km, the oblateness was 401.39, and the angle of direction was 100.39. The overall distribution is in the “northwest‒southeast” direction, the centripetal force increases, and the directional characteristics increase. In 2021, the X-axis is shortened to 1955.35 km, the Y-axis is shortened to 1,367.87 km, the oblateness is 587.48, and the angle of direction is 111.12, which reflects an increase in the degree of centripetal force and a weakening of directional characteristics. In addition, when the standard ellipse parameters from 2016 and 2021 are compared, the distribution directions are both in the “southwest-northeast” direction, but the flattening rate increases in 2020, indicating that the standard ellipse has a stronger “southeast-northwest” direction. This indicates that the standard ellipse has a stronger “” orientation.

Elliptic change of distribution standard deviation and shift of gravity (2016–2021). Note: This figure is based on the standard map No. GS(2020)4619 downloaded from the website of Standard Map Service of the Ministry of Natural Resources(https://www.mnr.gov.cn/) and the base map has not been modified.This figure was produced by using Arc Geographic Information System, ArcGIS, version 10.6 (https://www.arcgis.com/).
Figure 6b shows that the change in the center of gravity of the distribution of State-level Sports Industry Bases shows a slow shift, but it is mainly concentrated in the east-central provinces and regions such as Henan, Hubei and Anhui, indicating that the density of State-level Sports Industry Bases is greater in the eastern part of China, whereas the distribution in the western part is sparser. Among them, the center of gravity of the distribution in 2016–2017 shifted 153.55 km southeastward from 114.61. E, 32.74. N in southern Henan to 114.69. E, 31.57. N at the junction of Henan and Hubei and shifted 336.82 km northeastward to 117.32. E, 31.57. N in northern Anhui from 2017 to 2018. 117.32. E, 32.85. N. In 2018–2019, it moved southwestward by 200.28 km to the junction of Henan and Anhui at 115.57. E, 32.49. N. In 2019–2020, it continued to move southwesterly by 52.57 km to southern Henan at 115.12. E, 32.38 N. In 2020–2021, it moved northward by 75.79 km to 115.16 E, 32.95 N in Anhui. The counties belonging to it roughly follow Xincai County, Zhumadian city (2016)—Xin County, Xinyang city (2017)—Fengyang County, Chuzhou city (2018)—Funan County, Fuyang city (2019)—Hengchuan County, Xinyang city (2020)—Linquan County, and Fuyang city (2021) moving year by year. In the early stage of the development of the state-level Sports Industry Bases, the government’s policy orientation and planning and construction focus on the eastern region. From 2018 onward, the relevant state departments gradually focused on the development of the Sports Industry Bases in the western region and further revitalized the sports industry chain in the western provinces by facilitating the flow of resources and elements, promoting the process of sports industrialization and helping the growth of the sports market.
Analysis of factors influencing the spatial distribution of state-level sports industry bases
Selection of factors
At present, research on the factors influencing the spatial distribution of State-level Sports Industry Bases is mostly qualitative and less quantitative. Therefore, to integrate the comprehensiveness and rationality of the index system, in addition to referring to other industrial bases as well as the relevant research on sports towns, another similar manifestation of sports industry agglomeration, and synthesizing the research purpose of this paper, based on data accuracy and availability, the years 2016–2021 are selected, namely, the economic strength (per capita GDP), sports consumption market capacity (per capita sports service consumption expenditure of urban households), traffic density miles of highway per 10,000 km2), innovation level (number of invention patents per 10,000 people), government support (local financial expenditure on sports) and degree of urbanization development (urbanization level), to explore the effect on the number of State-level Sports Industry Bases. Some of the sports-related data statistics intersect with the education, culture and entertainment industries, drawing on Han et al.32 of data stripping ideas, the sectoral (industry) indicator weighting method is used to carry out data stripping of relevant indicators. In addition, to eliminate the influence of heteroskedasticity caused by the large range value of the constant data, the economic strength, traffic convenience, government support, sports consumption market capacity and regional innovation level are logarithmically processed, and the degree of urbanization development is not processed. Descriptive statistics for the indicators are shown in Table 3. After testing, the correlation coefficients between the indicators of each explanatory variable are less than 0.7, and the variance inflation factors (VIFs) are less than 5, indicating that there is no serious multicollinearity between the indicators, which can be further analyzed.
Regression results
The results of the panel negative binomial regression with robust standard errors, as measured by the regression model above, are shown in Table 4. In negative binomial regression, the standardized regression coefficients are generally interpreted in terms of the incidence rate ratio (IRR), or eβ. The effect of the independent variable can be examined in terms of the percentage change in the IRR coefficient, i.e., the percentage change in the dependent variable for each unit or standard deviation of increase in the independent variable while holding other variables constant (Table 4% column), the value obtained by this method is a standardized coefficient, which can directly measure and compare the relative importance of the impact of all independent variables on the number of State-level Sports Industry Bases33. In Model 1, when only economic strength and government support are taken as explanatory variables, both economic strength and government support can reject the original hypothesis at the 1% significance level; i.e., they have a positive effect on the growth of the number of State-level Sports Industry Bases in this provincial region. Specifically, an increase of one unit in per capita GDP will increase the number of State-level Sports Industry Bases in this province and region by 123.5%; an increase of one unit in government financial expenditure on sports will increase the number of State-level Sports Industry Bases in this province and region by 99.9%. Model 2 adds other explanatory variables for regression, and economic strength and government support play a more obvious role in increasing the number of State-level Sports Industry Bases. Moreover, the regional innovation level has a significant negative effect on the number of State-level Sports Industry Bases. Specifically, an increase of one unit in per capita GDP will increase the number of State-level Sports Industry Bases in the province by 233.9%; an increase of one unit in government financial expenditure on sports will increase the number of bases by 102.9%; an increase of one unit in per capita invention patents will decrease the number of bases by 20.8%; in addition, the capacity of the sports consumption market, the density of traffic and the degree of urbanization do not affect the growth of the number of State-level Sports Industry Bases in the province. In addition, the sports consumption market capacity, traffic density and degree of urbanization development have no significant influence on the growth of the number of State-level Sports Industry Bases in the province.
The better the regional economic situation and the greater the government’s financial expenditure on sports is, the easier it is for the local sports industry to develop a cluster, which also leads to growth in the number of State-level Sports Industry Bases. Analyzing the reasons, the better the regional economic development is, the more people’s disposable income increases, so the sports consumption input increases. Coupled with the increase in public health awareness, enthusiasm for physical exercise and consumption has gradually increased. Moreover, public demand and the government’s advanced support of policy make the development and declaration of sports industry projects, bases and units smooth. The regional innovation level reflects local scientific and technological strength to a certain extent, and the increase in scientific and technological strength inhibits the growth of the number of Sports Industry Bases, indicating that in the development of the sports industry in various provinces and regions of China, labor, land and capital are still the main driving forces of production, whereas the factors of production, such as information and data, have not been able to efficiently enhance the efficiency of the development of sports industry agglomeration, and scientific and technological resources have not yet been fully exploited, which also reflects the government’s concern for the development of Sports Industry Bases and units. This finding also reflects that the government’s support for the development of Sports Industry Bases is more favorable for provinces where traditional production factors are concentrated.
Robustness test
To test the robustness of the regression results of the panel negative binomial regression model (Model 2), this paper uses the zero-inflated negative binomial regression model (Model 3), the panel Poisson regression model (Model 4), the zero-inflated Poisson regression model (Model 5), and the mixed OLS regression model (Model 6) to conduct a comparative analysis, and the results are shown in Table 5.
Notably, the estimated coefficients of Model 3–Model 5 do not indicate the marginal effect and are interpreted only as semi-elasticity, which is not numerically comparable with the estimated coefficients of Model 5; thus, only the positive and negative directions are compared. A comparison shows that the estimated coefficients of all regression models are the same, especially Model 2–Model 5, which are the same counting model and have good consistency, which verifies the conclusions in Table 4. In summary, the empirical results of this paper are robust and valid.